[MIT 6.1810]Lab2 system calls
1 Using gdb(easy)
gdb配置
使用gdb调试
- 运行
make qemu-gdb命令 - 另外一个窗口中运行
riscv-64-unknown-elf-gdb kernel/kernel命令 - 然后在gdb环境中运行
(gdb) target remote localhost:26000命令即可
3中的端口号在.gdbinit文件中查看:
1 | |
使用vscode调试
运行
make qemu-gdb命令将上述.gdbinit文件中的第4行删除
配置vscode的launch.json文件
1
2
3
4
5
6
7
8
9
10
11
12
13
14
15
16
17
18
19
20
21
22
23
24
25
26
27
28
29
30{
"version": "0.2.0",
"configurations": [
{
"name": "debug xv6",
"type": "cppdbg",
"request": "launch",
"program": "${workspaceFolder}/kernel/kernel",
"args": [],
"stopAtEntry": true,
"cwd": "${workspaceFolder}",
"miDebuggerServerAddress": "localhost:26000", // 按照.gdbinit中的端口号
"miDebuggerPath": "/opt/riscv/bin/riscv64-unknown-elf-gdb", // gdb目录
"environment": [],
"externalConsole": false,
"MIMode": "gdb",
"setupCommands": [
{
"description": "pretty printing",
"text": "-enable-pretty-printing",
"ignoreFailures": true
}
],
"logging": {
// "engineLogging": true,
// "programOutput": true,
}
}
]
}点击vscode中的调试,程序到达内核main的地址
在vscode底部的调试控制台输入命令
-exec file user/_sleep切换符号表为sleep.c文件在sleep.c中打断点,进行调试即可
题目
Looking at the backtrace output, which function called
syscall?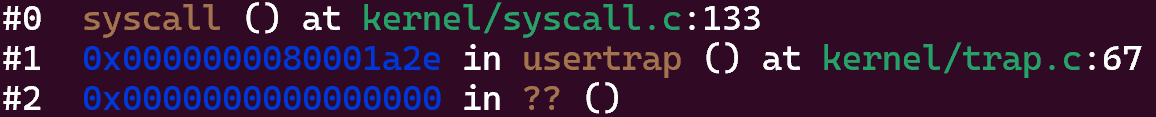
从图中可以看到,是usertrap这个函数调用了syscall函数。
1
2
3
4
5
6
7
8
9
10
11
12
13
14
15
16
17
18
19
20
21
22
23
24
25
26
27
28
29
30
31
32
33
34
35
36
37
38
39
40
41
42
43
44
45
46
47
48
49void
usertrap(void)
{
int which_dev = 0;
if((r_sstatus() & SSTATUS_SPP) != 0)
panic("usertrap: not from user mode");
// send interrupts and exceptions to kerneltrap(),
// since we're now in the kernel.
w_stvec((uint64)kernelvec);
struct proc *p = myproc();
// save user program counter.
p->trapframe->epc = r_sepc();
if(r_scause() == 8){
// system call
if(killed(p))
exit(-1);
// sepc points to the ecall instruction,
// but we want to return to the next instruction.
p->trapframe->epc += 4;
// an interrupt will change sepc, scause, and sstatus,
// so enable only now that we're done with those registers.
intr_on();
syscall();
} else if((which_dev = devintr()) != 0){
// ok
} else {
printf("usertrap(): unexpected scause 0x%lx pid=%d\n", r_scause(), p->pid);
printf(" sepc=0x%lx stval=0x%lx\n", r_sepc(), r_stval());
setkilled(p);
}
if(killed(p))
exit(-1);
// give up the CPU if this is a timer interrupt.
if(which_dev == 2)
yield();
usertrapret();
}从上述代码中可以看到,usertrap中根据scause寄存器判断trap原因,然后进入不同的分支进行处理。对于系统调用,它调用syscall函数处理。
What is the value of
p->trapframe->a7and what does that value represent? (Hint: lookuser/initcode.S, the first user program xv6 starts.)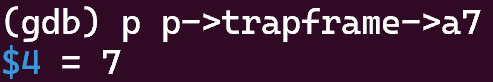
从图中可以看到,a7寄存器的值是7,这对应的是7号系统调用,即SYS_exec。
1
2
3
4
5# initcode.S
la a0, init
la a1, argv
li a7, SYS_exec
ecall从initcode.S中可以看到,这段代码将SYS_exec的值载入寄存器a7中,然后执行ecall命令。这表示之后要执行exec系统调用。
What was the previous mode that the CPU was in?

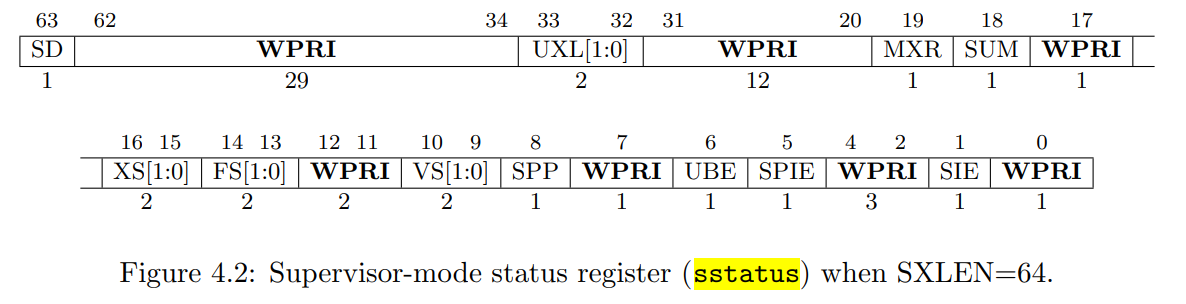
由图可知,sstatus寄存器的第8位是0,表示之前CPU处于用户模式。
Write down the assembly instruction the kernel is panicing at. Which register corresponds to the variable
num?将syscall中的
num = p->trapframe->a7修改为num = *(int*)0然后重新运行,结果如下: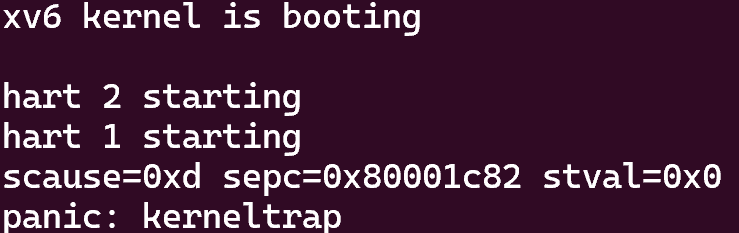
在kernel.asm文件中搜索sepc的值,结果如下:

可以看到,正是我们修改的指令导致内核panic,变量
num对应寄存器a3.重新运行gdb,在上面sepc指出的指令处打断点,结果如下:
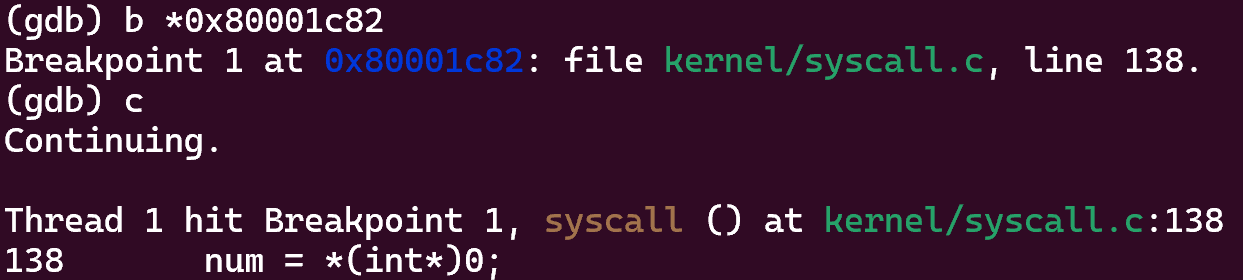
可以看到,出错的指令正是该条修改过的指令。
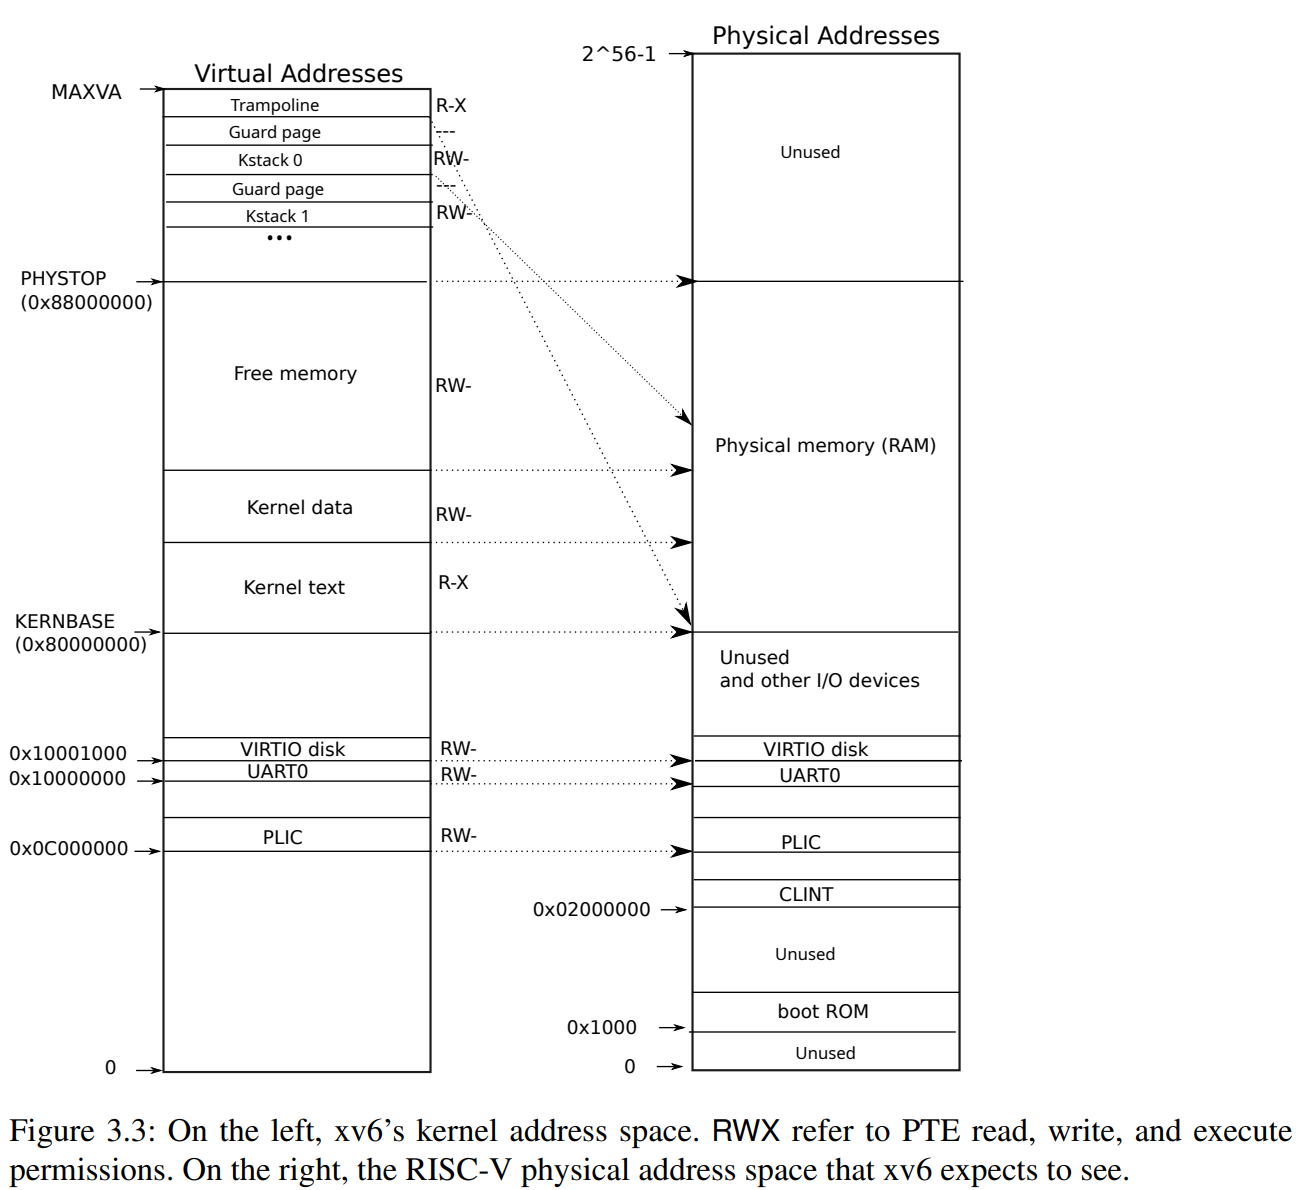
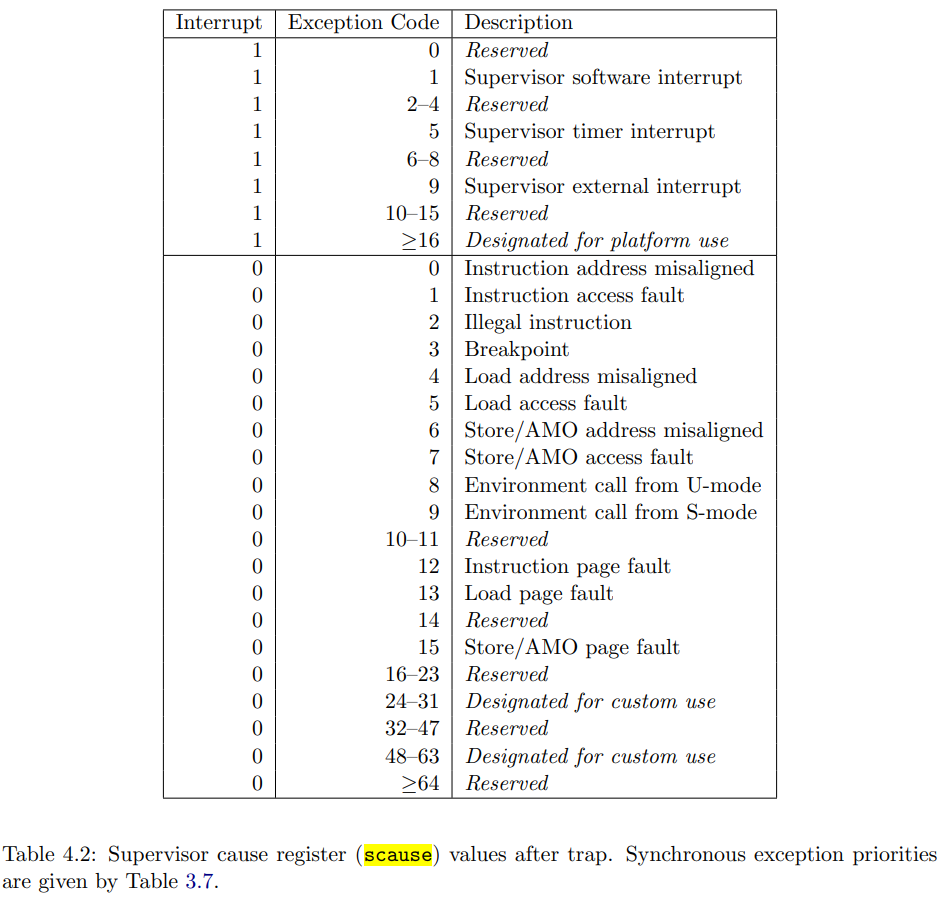
Why does the kernel crash? Hint: look at figure 3-3 in the text; is address 0 mapped in the kernel address space? Is that confirmed by the value in
scauseabove? (See description ofscausein RISC-V privileged instructions)从下图中可以看到,内核地址空间中的地址0并未进行映射,因此无法进行访问,所以内核出错的原因应该是内存访问错误。
scause寄存器的值为0xd,查看对应的原因为load page fault,这印证了上述的推理。
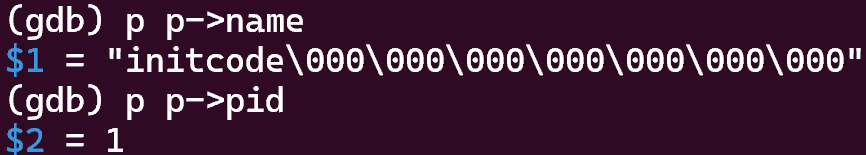
What is the name of the process that was running when the kernel paniced? What is its process id (
pid)?从下图中可以看出,进程的名字是initcode,pid为1.
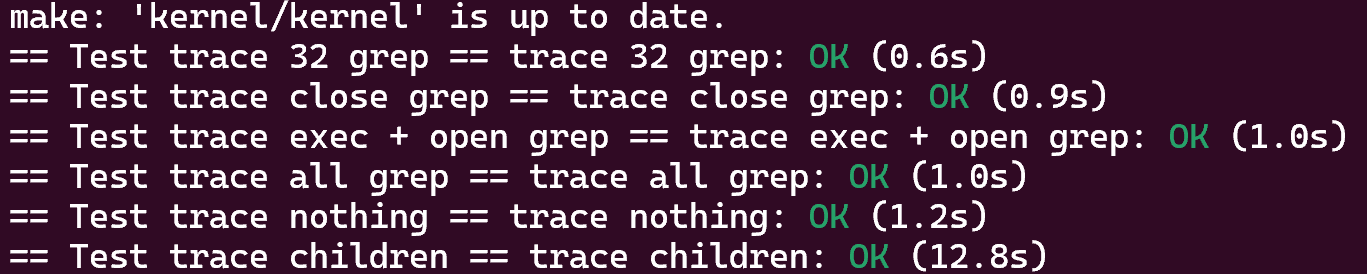
2 System call tracing (moderate)
In this assignment you will add a system call tracing feature that may help you when debugging later labs. You’ll create a new trace system call that will control tracing. It should take one argument, an integer “mask”, whose bits specify which system calls to trace. For example, to trace the fork system call, a program calls trace(1 << SYS_fork), where SYS_fork is a syscall number from kernel/syscall.h. You have to modify the xv6 kernel to print a line when each system call is about to return, if the system call’s number is set in the mask. The line should contain the process id, the name of the system call and the return value; you don’t need to print the system call arguments. The trace system call should enable tracing for the process that calls it and any children that it subsequently forks, but should not affect other processes.
本题要求添加一个系统调用来跟踪系统调用的顺序。
为了添加一个系统调用,需要进行一下几步:
在user/user.h文件中声明系统调用的函数。
1
2// user/user.h
int trace(int);在user/usys.pl添加一个stub,之后makefile会执行perl脚本在user/usys.S中生成实际的stub汇编指令。
1
2// user/usys.pl
entry("trace");在kernel/syscall.h中添加系统调用号
1
2// kernel/syscall.h
#define SYS_trace 22在kernel/syscall.c中添加系统调用的外部声明,并修改系统调用表。
1
2
3
4
5
6
7
8// kernel/syscall.c
extern uint64 sys_trace(void); // 外部声明
static uint64 (*syscalls[])(void) = { // 修改系统调用表
[SYS_fork] sys_fork,
// ...
[SYS_trace] sys_trace,
};在kernel对应的文件中实现系统调用
1
2
3
4
5
6
7
8
9// kernel/sysproc.c
uint64
sys_trace(void)
{
int mask;
argint(0, &mask);
myproc()->tracemask = mask;
return 0;
}
本题涉及的代码不复杂,主要流程如下:
修改proc结构体,在该结构体中添加一个mask变量,用来指示需要跟踪的系统调用
1
2
3
4
5
6
7
8
9
10
11
12
13
14
15
16
17
18
19
20
21
22
23
24
25
26
27// kernel/proc.h
// Per-process state
struct proc {
struct spinlock lock;
// p->lock must be held when using these:
enum procstate state; // Process state
void *chan; // If non-zero, sleeping on chan
int killed; // If non-zero, have been killed
int xstate; // Exit status to be returned to parent's wait
int pid; // Process ID
// wait_lock must be held when using this:
struct proc *parent; // Parent process
// these are private to the process, so p->lock need not be held.
uint64 kstack; // Virtual address of kernel stack
uint64 sz; // Size of process memory (bytes)
pagetable_t pagetable; // User page table
struct trapframe *trapframe; // data page for trampoline.S
struct context context; // swtch() here to run process
struct file *ofile[NOFILE]; // Open files
struct inode *cwd; // Current directory
char name[16]; // Process name (debugging)
int tracemask; // trace mask (debugging)
};实现sys_trace,将系统调用参数存储到进程的proc结构体中
如上5所示。
修改syscall函数,在系统调用返回之前,根据mask进行相应的输出
1
2
3
4
5
6
7
8
9
10
11
12
13
14
15
16
17
18
19
20
21
22
23
24
25// kernel/syscall.c
void
syscall(void)
{
int num;
struct proc *p = myproc();
num = p->trapframe->a7;
if(num > 0 && num < NELEM(syscalls) && syscalls[num]) {
// Use num to lookup the system call function for num, call it,
// and store its return value in p->trapframe->a0
p->trapframe->a0 = syscalls[num]();
if ((1 << num) & (p->tracemask))
{
acquire(&p->lock);
int pid = p->pid;
release(&p->lock);
printf("%d: syscall %s -> %ld\n", pid, syscallnames[num], p->trapframe->a0);
}
} else {
printf("%d %s: unknown sys call %d\n",
p->pid, p->name, num);
p->trapframe->a0 = -1;
}
}修改fork函数,将mask拷贝到子进程
1
2
3
4
5
6
7
8
9
10
11
12
13
14
15
16
17
18
19
20
21
22
23
24
25
26
27
28
29
30
31
32
33
34
35
36
37
38
39
40
41
42
43
44
45
46
47
48
49
50
51
52
53
54// kernel/proc.c
// Create a new process, copying the parent.
// Sets up child kernel stack to return as if from fork() system call.
int
fork(void)
{
int i, pid;
struct proc *np;
struct proc *p = myproc();
// Allocate process.
if((np = allocproc()) == 0){
return -1;
}
// Copy user memory from parent to child.
if(uvmcopy(p->pagetable, np->pagetable, p->sz) < 0){
freeproc(np);
release(&np->lock);
return -1;
}
np->sz = p->sz;
// copy saved user registers.
*(np->trapframe) = *(p->trapframe);
// Cause fork to return 0 in the child.
np->trapframe->a0 = 0;
// increment reference counts on open file descriptors.
for(i = 0; i < NOFILE; i++)
if(p->ofile[i])
np->ofile[i] = filedup(p->ofile[i]);
np->cwd = idup(p->cwd);
safestrcpy(np->name, p->name, sizeof(p->name));
pid = np->pid;
// copy tracemask from the parent;
np->tracemask = p->tracemask;
release(&np->lock);
acquire(&wait_lock);
np->parent = p;
release(&wait_lock);
acquire(&np->lock);
np->state = RUNNABLE;
release(&np->lock);
return pid;
}
结果如下:
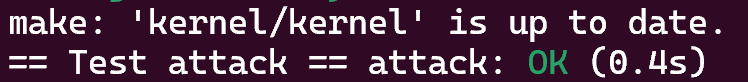
3 Attack xv6 (moderate)
user/secret.c writes an 8-byte secret in its memory and then exits (which frees its memory). Your goal is to add a few lines of code to user/attack.c to find the secret that a previous execution of secret.c wrote to memory, and write the 8 secret bytes to file descriptor 2. You’ll receive full credit if attacktest prints: “OK: secret is ebb.ebb”. (Note: the secret may be different for each run of attacktest.)
You are allowed to modify user/attack.c, but you cannot make any other changes: you cannot modify the xv6 kernel sources, secret.c, attacktest.c, etc.
本题指出xv6中故意引入了几个bug,在申请内存和释放内存后,故意不清除其中的内容,这样我们可以在一个进程退出后,立即申请到它申请的内存,从而访问到另外进程的内容。
1 | |
可以看到,secret.c中申请了32页的内存,然后在第9页中第32字节处写入8个字节的内容。
1 | |
我们在attack.c中同样申请32页内存,但是如果我们直接查看第9页的内容,发现不对,这是因为xv6管理空闲页是通过 freelist 链表来管理的,当申请内存时,从链表头部取下一个页面,但释放一页内存的时候,使用头插法将内存页插入到链表中,这样就会呈现出栈的性质。接下来,尝试查看第22页的内容,发现仍然不对,最后通过尝试发现,实际的内容在第17页。
1 | |
user/secret.c copies the secret bytes to memory whose address is 32 bytes after the start of a page. Change the 32 to 0 and you should see that your attack doesn’t work anymore; why not?
这是因为xv6管理空闲页是通过链表来管理的,它将链表的结点直接存放在空闲页开始的 run 结构体中,因此释放一页内存的时候,总是会修改其0字节处一段空间的内容,用来存放链表结点,所以如果将内容存放在0字节处,一定会被覆盖掉。
结果:
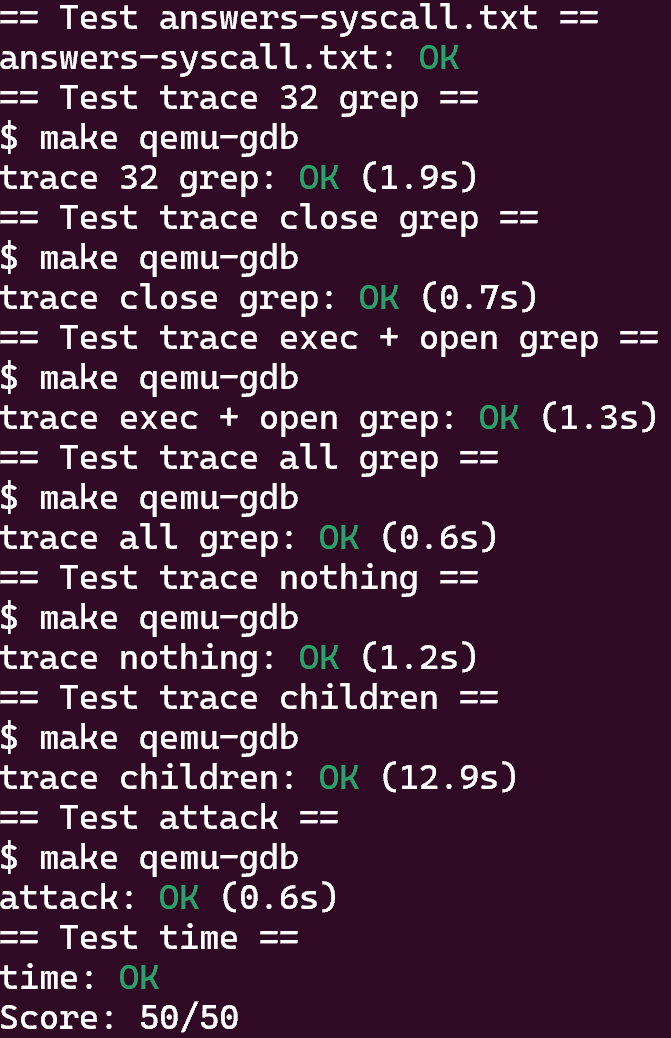
4 测试